Through the following introductory tasks in this matlab textbook (super #sassy and #funny) by Allen Downey and read chapters 1-4.
General Tips/Notes for coding in Matlab:
- % denotes a comment; define what a program does, preconditions, postconditions
- ; suppresses the output of the command (otherwise printed in the console)
- ... breaks up a line that can take up multiple lines
- 1/0 denotes true and false (respectively)
- ~= not equal
- script - a savable file/program (not working in the console/interactions pane)
- to run a file, save it and then run (always save before running)
- who - this command prints the names of the variables
- clear _variable name_ - removes/deletes the variable
- disp(z) - prints the value of the variable z
- matrix = ones(2, 3) - creates a matrix named matrix filled with ones that is two rows by three columns
- **indices for accessing stuff in matrices start at 1**
- all loops/compound statements: for, while, if/else are closed with "end"
- running a file in the console:
- name of the file
- >>fibonacci2
- or if n needs to be specified
- >>n=10; fibonacci2
Exercise 2.1: fibbonacci1 script
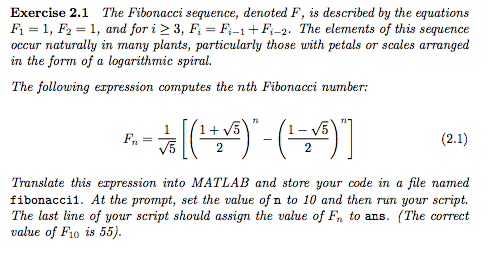

Console:

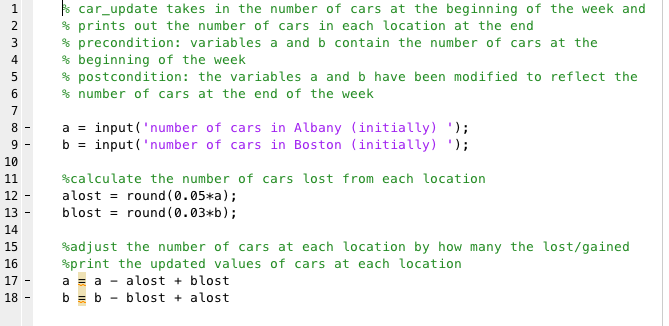
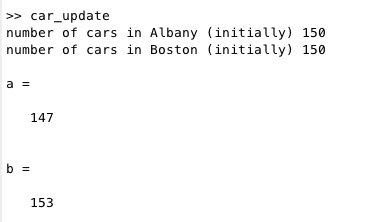
Exercise 2.3: car_update script
The problem with this code is that you would have to input the number of cars at Albany and Boston for every week that you wanted the computation done. (re-enter the new car numbers, so for computing the numbers over multiple weeks, would have to call the script many times)
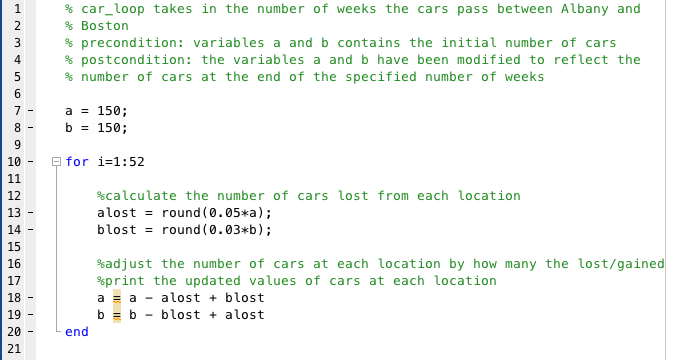
Exercise 3.1: car_loop script
With each run of the loop, updates the variables a and b to the be the number of cars at the respective locations (Albany and Boston).

Exercise 3.2: car_loop script w/ plotting
This exercise plots the car numbers at Albany(red) and Boston(blue) over the 52 weeks.
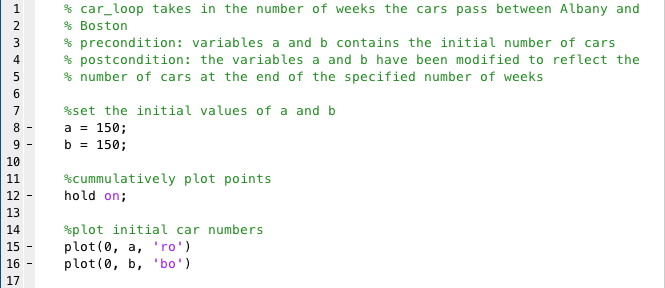
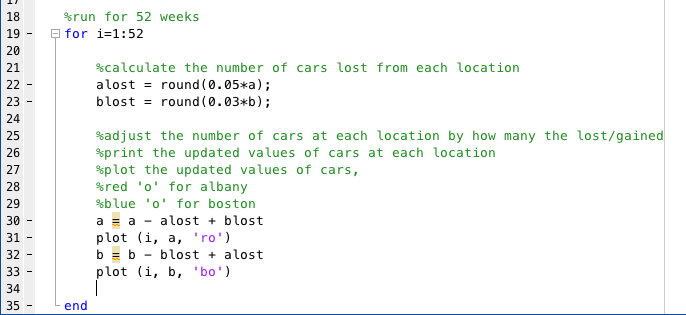


(you can see a clear equilibrium point between the two locations)
Run for initially 10000 cars at Albany and 10000 cars at Boston.

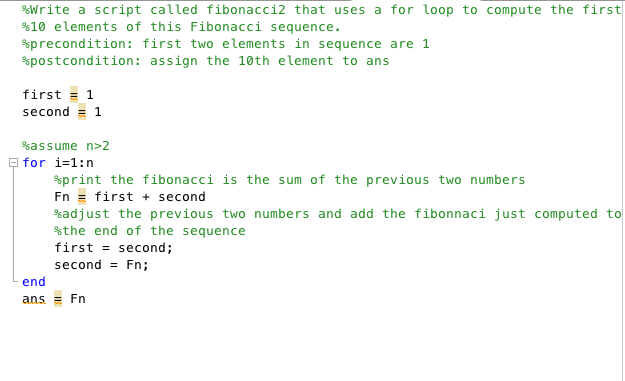
Exercise 3.5: fibonacci2 sequence script
>> n=10; fibonacci2

>> n=15; fibonacci2

>>n=20; fibonacci2

**TAKE NOTE: n starts counting at the third fibonacci number**
Exercise 4.6: plotting fibonacci ratios
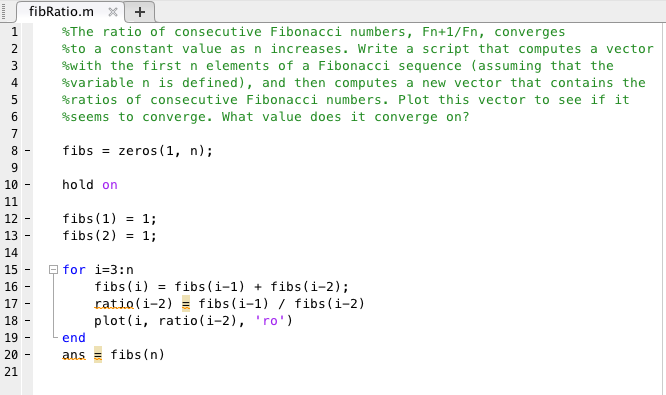

(as you can see, the fibonacci ratios converged about 8 terms in to a value at about 1.6)
Baseball Simulation:
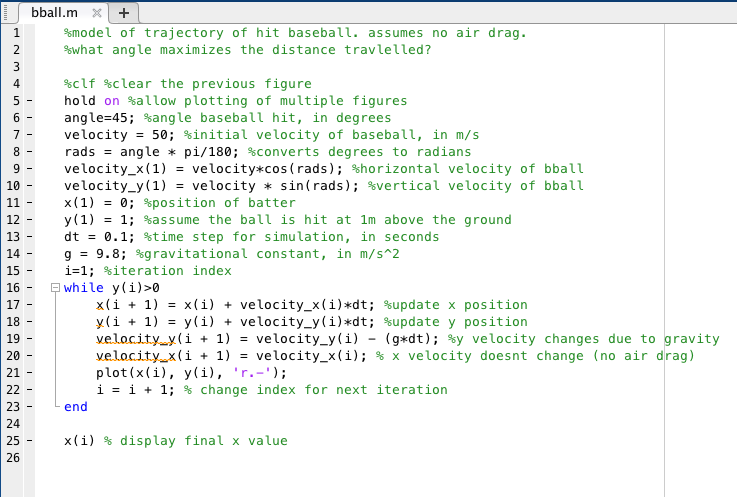

Max angle: 45 degrees, x value is 261.6295m
If you graph many other angles (leaving the 45 degrees trial red), you get the following graph:
angles tried: 30, 40, 43, 47, 50, 60

Modification: You could easily create a new script to call the bball script multiple times (in a loop), adjusting the angle each time and then at the end, returning the max angle value and the max x distance rather than manually doing trial and error
Skills:
- matlab
- plotting
- functions
- for loops
- if/else loops

my favorite catch ever #gocubs

No comments:
Post a Comment